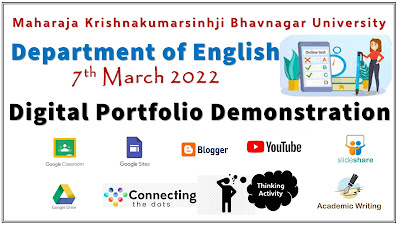
Welcome to Project Blended Learning 2010-20!
Note: Click on the below-given web link to view students' updated ePortfolios/digital portfolios
On this site, which is a sort of digital locker of students, you will find records of all curricular, co-curricular, and other activities of students of the following batches:
The purpose of this site - http://sites.google.com/site/projectblendedlearning2012 :
1. To share action research carried out at Department of English,
Bhavnagar University (Gujarat, India).
2. To display the projects submitted by students.
3. To present the outcomes of the experiment on Blended Learning.
 |
| Project Blended Learning 2012 |
This site is run by the Department of English, Bhavnagar University. The site is designed by Dr. Dilip Barad with the specific purpose of organizing projects submitted by the students. On this site you will find all the Google Sites submitted by students as a part of the partial fulfillment of continuous internal assessment. The students were supposed to use Blogger for assignments, Slideshare for presentations, and YouTube for videos of their presentations.
This project was carried out with a dual purpose. Firstly, to fulfill one of the objectives of the UGC to have innovations in teaching and learning with the help of ICT integration. Secondly, it was to experiment with blended learning. We wanted to experiment with the feasibility of ICT integration with traditional face-to-face teaching methods. The Google Group was used for instructions, sharing, collaboration, and building eCommunication among faculty and students. Click on Department of English Google Group or scroll down to read archived communications.
By clicking on the image of a student, you will be able to see the work done by her/him during four semesters from June 2010 to April 2012.
The outcome of this project will be available here.
* These charts display the percentage variation in B.A. (Bachelor of Arts) and M.A. (Master of Arts). Almost all the students, except for one in each batch, displayed good improvement in their university examination. These real examinations (and not the faked ones like pre-post-tests) are used as substantial proof to prove that students show remarkable improvement in their learning capacities when face-to-face teaching is blended with technology-based learning.
* In the below-given chart (Batch 2010-12), we can see that the percentage of only one student decreased as compared to that of BA. The green bars reflect the percentage of MA and the blue bars that of BA.
 |
| Advantage Blended Learning (2010-12) All students improved their performance in real-life University exam |
 |
| Advantage Blended Learning (2011-13) All students improved their performance in real-life University exam |
 |
| Advantage Blended Learning (2012-14) All students improved their performance in real-life University exam |


No comments:
Post a Comment